Once a project is selected, landscape ecology, watershed information, and other relevant data can be used as art of the site assessment process for buffers. The site assessment process often varies depending on the watershed goals and general design concepts for the buffer. The following table summarizes primary information to be collected for site assessment and lists how the information may influence design.
Information |
Importance for Vegetation Plan Development |
|---|---|
Site Topography and Contours |
Potential areas of nutrient and pollutant concentrations as well as planting zones, seed mixes, and other planting strategies. |
Geology and Soils Information |
Erosion potential as well as nutrient levels and infiltration rates. |
Land-Use Information from Aerial Photographs and Site Visits |
Possible threats such as invasive species, nutrients, and changing water levels. Will help determine where buffers and corridors can be most effective to reduce fragmentation, connect remnant patches, and decrease edge effect. |
Subsurface Drainage |
In agricultural areas drain tile may bypass a buffer, creating a need or additional conservation practices to treat nutrients. |
Previous Land-Use |
Look for evidence of sedimentation of wetland basins or other erosion problems, the introduction of aggressive species, as well as fertilizer, herbicide, and pesticide use. |
Historic Vegetation |
Helps to select plant communities and species appropriate for the site. |
Existing Seedbank Potential |
A threat or a benefit, it may influence the planting strategies, seed mixes, and control efforts. |
Site Photography |
Aerial and ground-level images can be a good reference during buffer plan development. Also useful for tracking restoration establishment. |
Existing Native Vegetation |
Planning for site preparation, planting, and maintenance strategies. |
Existing Invasive Vegetation |
Understand invasive risk aids planning for site preparation, planting, and maintenance strategies |
Reference Plant Communities |
Native plant communities in surrounding areas help assess project opportunities and potential challenges. |
Hydrologic Data |
Pezometric data may reveal groundwater flow. Stream or ephemeral overland flow could influence buffer placement. |
A variety of GIS data for Minnesota is now available on the Minnesota Geospatial Information Office such as original land survey maps, Lidar data, and air photos.
It is helpful to create a site assessment diagram that illustrates how site conditions will influence project design. Site assessment diagrams can be sketched quickly and tend to include: location of waterbodies, physical structures, roads, walkways, fields, areas of steep slopes, drainage-ways, remnant vegetation, existing buffers, and locations of invasive species. Essentially, anything that will influence the project design can go on the site assessment diagram.
As a site is assessed, project opportunities may become more apparent and project goals, objectives, and outcomes can be further refined. For example, a site connected to a natural plant community with low invasive species pressure may be found to provide many wildlife benefits in addition to water quality improvement.
Site Assessment Diagram
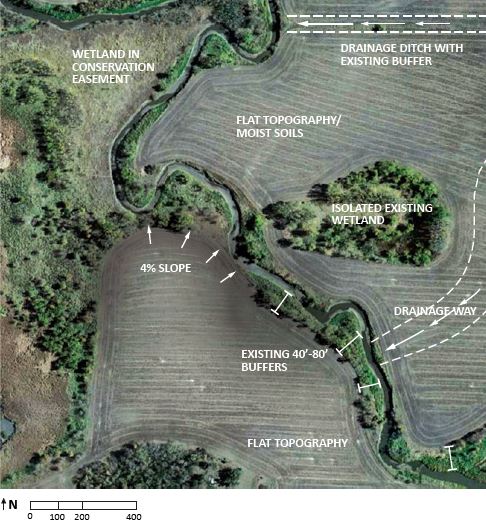
This site assessment diagram shows an existing wetland, moist soils and a drainage-way north of the river that will each influence design strategies to improve wildlife habitat and nutrient treatment. South of the river slopes and narrow buffer widths are identified to guide planning to meet the state’s buffer law.